Earth Observation and Ecosystem Accounting
Part II – How EO experts can support the new SEEA EA framework
This is the second in a two-part series, in which we explore the new SEEA framework and examine how EO can play a role in supporting ecosystem accounting. Find Part I here.
Have you ever wondered how your local forest contributes to the economy if it’s not harvested for lumber? Or how do we translate a wetland’s ability to store and filter water into a monetary value? We need answers to these types of vital questions as the EU informs and develops sustainable policies for the future. We need a consistent and robust way of tracking how the environment interacts with the economy, and our well-being.
The EU plans on honouring this mindset. The European Green Deal aims to achieve a climate-neutral Europe by 2050. Along with climate neutrality, the EU expects progress towards the UN’s Sustainable Development Goals (SDGs) from its members and allies. How can we accomplish this?
Besides actual policy changes to reach these targets, we need a variety of consistent and integrated data to inform how the environment affects and changes with the economy. EU member states now have an obligation to statistical sustainable reporting to inform these policies.
What reporting can we do that is feasible, comprehensive, and high-quality? The UN’s System of Environmental Economic Accounting (SEEA) has rigorously developed Ecosystem Accounting (EA) to answer this call. The SEEA EA is now regarded as the international standard for Ecosystem Accounting, and the EU has adopted this framework in 2021.
Ecosystem accounting is a statistical framework which unifies spatially explicit and monetary data that evaluates and tracks ecosystems and their assets (e.g. biodiversity, lumber, etc.) and how these assets interact with our economy and contribute to our well-being.
If you’re not familiar with many accounting terms, EA can initially be overwhelming. EA applies stock and flow principles which are typically used in financial accounting, but also often used when describing natural stocks such as CO2. These principles of accounts, stocks and flows are key to enabling a unified terminology and integrating environmental variables with monetary values. Linking these physical properties to monetary values allows us to compare nature to other services and economic activities in our lives. However, they do not “put a price” on nature.

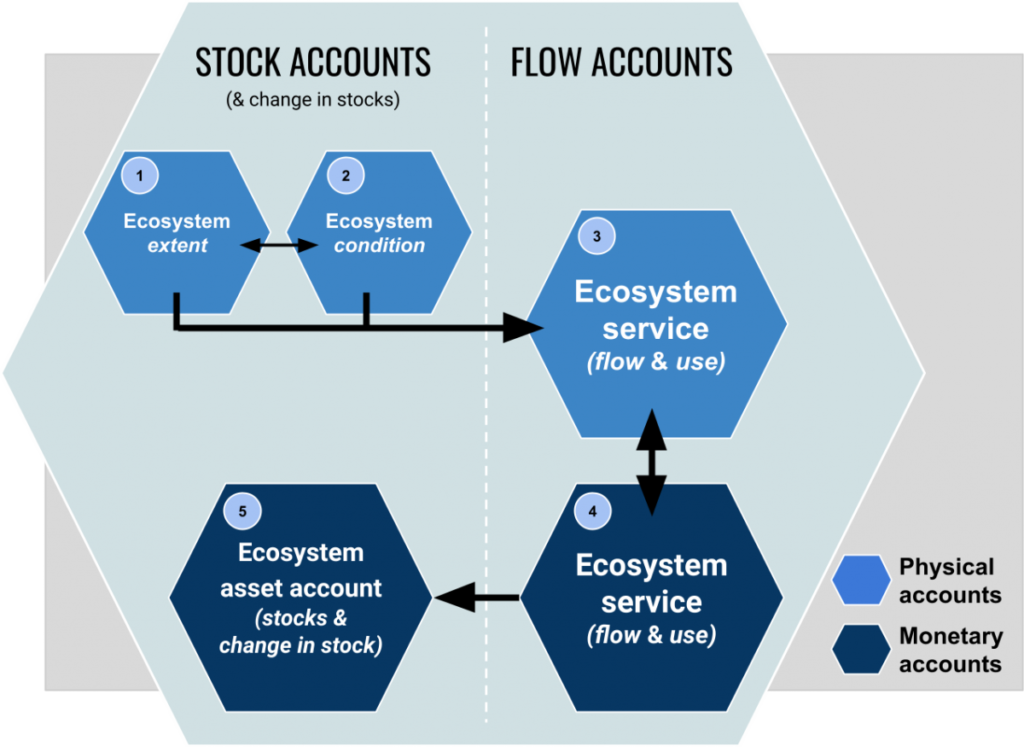
Figure 1: SEEA – Ecosystem Accounting Framework
EA is divided into five main accounts. These accounts are a stock or a flow and will report physical or monetary values.
Ecosystem extent—size of a classified ecosystem and its changes in size.
Ecosystem condition—includes biophysical and other landscape/seascape characteristics of ecosystems to define the ecosystem’s “quality”.
Ecosystem services (physical)—services that ecosystems provide that benefit society described by their physical flows.
Ecosystem services (monetary)—services that ecosystems provide that benefit society described by their financial flows.
Ecosystem services accounts—estimates the monetary value of the ecosystem services.
The most relevant accounts to Earth Observation (EO) specialists are the physical accounts: ecosystem extent, ecosystem condition and ecosystem services. The EA framework also reorganises these accounts with additional data into thematic accounts such as Climate Change, Biodiversity and Urban Areas.

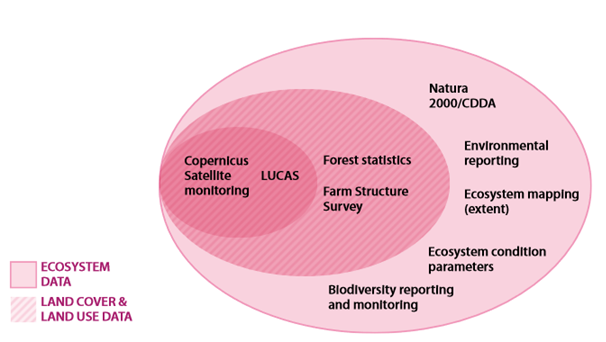
Figure 2: Bringing Ecological and Spatial Data Together – INCA Report, European Environmental Agency (EEA)
Earth Observation is an essential partner in Ecosystem Accounting. Without EO specialists, quality EA reporting isn’t possible.
The main interaction of the EO community will be with the National Statistic Institutes (NSIs) in the case of EU member states, where EA reporting is an obligation. The role of these offices is changing from data producer to data steward. NSIs will face a lot of challenges that require support and fast from a variety of experts (including EO experts) to get data on par with national statistical standards.
However, EU member states aren’t the only ones with an obligation to report environmental statistics. All large non-listed companies in the EU are required to collect information for sustainability statistics as a part of the Non-Financial Reporting Directive (NFRD). Sustainable reporting will be important for a variety of businesses, institutions and other stakeholders. By this October, the EU is expanding on the NFRD to small and medium-sized enterprises (SMEs). SMEs are required to implement sustainable reporting in several steps, starting in 2023 as a part of the Corporate Sustainability Reporting Directive (CSRD).
How does EA relate to sustainability reporting for businesses? The huge data overlap. The solutions and data developed for NSIs can be reapplied and specialised for business reporting. ESG metrics (Environment, Society and Governance) are the foundation of business reporting in the CSRD, but certain market sectors will need spatial data to report their full level of impact at the EU’s standard.
EO specialists will also need to support each other! The manuals and technical documentation at this stage are severely lacking. The SEEA and other entities haven’t published step-by-step manuals on reporting and accounting yet. How to calculate ecosystem condition for a variety of classifications is definitely a must.
The first challenge is processing and using the spatial data needed to produce ecosystem extent maps.
Ecosystem extent includes the classification of an ecosystem and its spatial area. The spatial resolution and classification level of these extents will determine the level of detail for the other remaining accounts. This means providing detailed land cover maps is a core part of the framework.
So what is the classification scheme? The EU pilot programme for Ecosystem Accounting (INCA) used the Corine Land Classification System and built their ecosystem extent maps using the Copernicus Earth Observation data programme to develop the Mapping and Assessment of Ecosystems and their Services (MAES). This classification has been the standard at level EU reporting, however, other stakeholders may require other classification systems for thematic accounts. For example, biodiversity accounts could be better described using the EUNIS/IUCN typology, based on habitats from the European Environmental Agency (EEA). Some classifications heavily favour terrestrial classification versus aquatic ecosystems. Can EO provide an equal classification or support for them all? Providing interoperability between different classification schemes will be a crucial task for EO. We cannot simply rely on a singular classification typology.
The relevant characteristics and variables are used to define Ecosystem Condition as a dimensionless value from 0 to 1. The biophysical and landscape values used to determine the condition depend on the ecosystem and the classification. As an example, a forest ecosystem could include tree age and density, fragmentation, species biodiversity, etc. to determine its condition.
EO-derived abiotic and biotic variables can play a role by producing relevant data products for under-reported areas or to replace some costly in-field data collection. Even during the pilot programme described in the INCA report by Eurostat, the JRC found that only 50% of the datasets available in the EU in 2018 to describe ecosystem conditions were collected consistently enough to create accounts. Detailed and consistent accounts will involve great effort to bring the data to the same quality and confidence level as other national statistics, such as GDP or census data.
However, given the variability of classification systems, determining which variables contribute to ecosystem condition and how we calculate this is not clear. The ability of this condition indicator value (0-1) to entirely represent ecosystem integrity is also debatable depending on the ecosystem and requires more research.
NSIs, SMEs and other stakeholders will need continued support from EO specialists year after year. This includes providing analysis ready data, tools and platforms with a variety of turn-key solutions for specific/thematic accounts, ecosystems and areas.
Ecosystem Classification will be the most probable candidate for automation, especially given the variety of typologies and interoperability expected. Setting up automation and assuring their quality will initially be the most crucial. After we achieve this, ensuring access and dissemination to all relevant stakeholders is next. NSIs can also look to EO for inspiration in this type of data dissemination. Large spatial datasets and data sharing are inherent in the EO operation sphere, such as the Copernicus data portal.
The EA framework isn’t an entirely static system. Although tested and assisting policy in 34 countries, the EA framework is still in its infancy.
There will be additions or revisions after the framework becomes further integrated into the economic reporting infrastructure. EO research can provide support and suggestions in several key areas, such as:
The European Space Agency (ESA) is bringing together EO specialists with EA specialists this fall! The 2022 Workshop on Earth Observation for Ecosystem Accounting event is 28 November through 1 December. The deadline for abstracts is 12 September. Registration is currently open!
You can also check out the MAIA and EOcafé webinars or examples of national level accounting on the MAIA data portal.
Want to see companies already involved in Ecosystem Accounting? You can check out companies in the INCA project.